|
JOIN OUR MAILING LIST |
|
Assessments / Blog 2018-10-05 ES #F Supply with higher Volatility
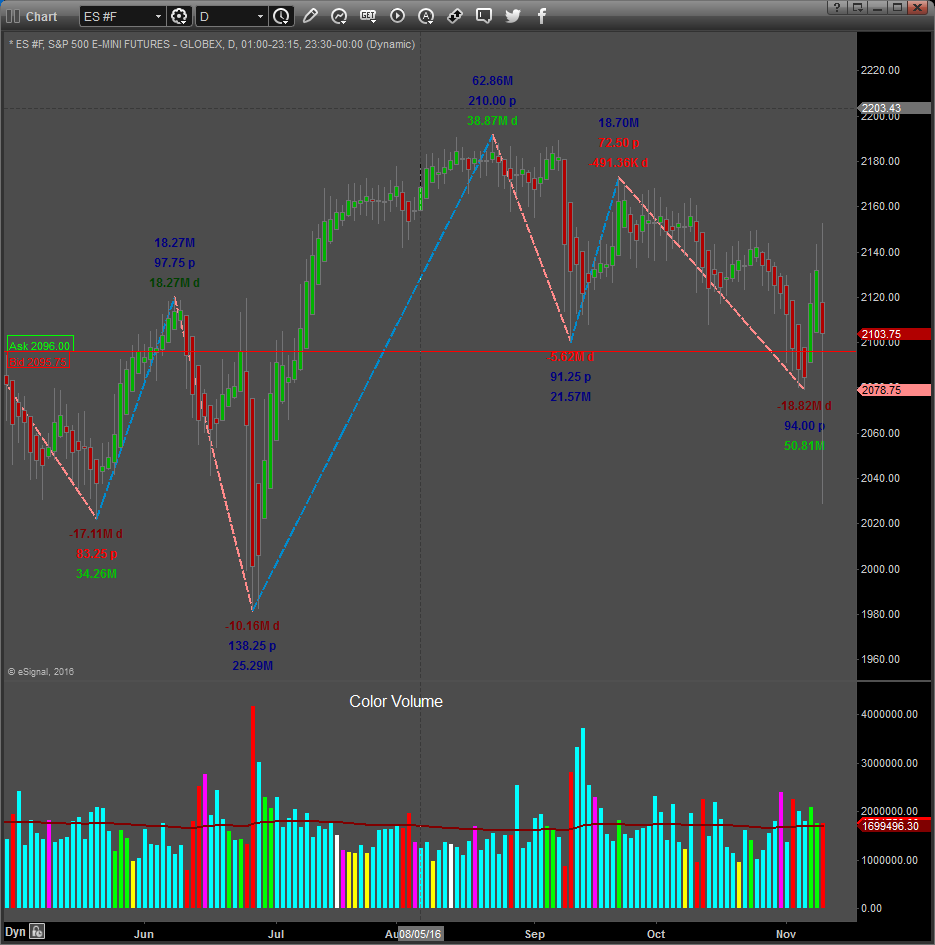
The daily chart of the S&P 500 mini futures contract above, shows our proprietary SUPPLY and DEMAND Dashboard and BXB (Bar by Bar) Signals using data from the NYSE. On Wednesday government bond yields were pushed to multi-year highs, which curbed the appetite for stocks globally. The ES lost 23.75-points Yesterday on high Volatility change (Average Volatility increased by 25%). Price reached the end of the triangle, and the next move could be important. A bar close above 2914.50 should favour the Bulls. The Sell-off Yesterday was not totally convincing, given the strong close and the fact that the current downswing volume (still in progress) is the lowest downswing volume in a long time. At the time of this writing Buying pressure is developing. At the moment it seems there is a possibility for more weakness, but not conclusively convincing. Daily Signals October the 4th: S & D Dashboard algorithm and Daily Signals turned bearish, except for average % > VWAP Caution: A bar close today above or below 2914.50 could give an indication of the next near term move. Average Volatility is still high (above 100%). Link to Facebook Group where these assessments are also posted regularly. Click here for example of reversal trade taken in Feeder Cattle that can be found on this page. |


