|
JOIN OUR MAILING LIST |
|
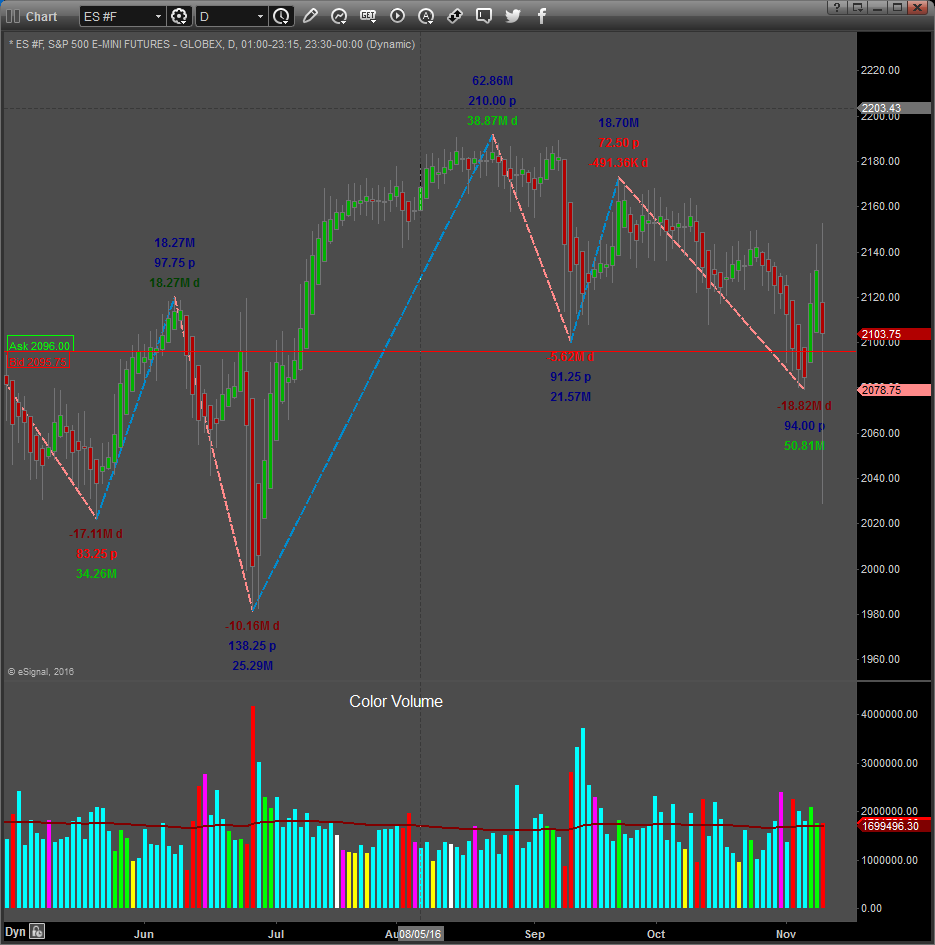
Assessments / Blog 2018-11-24 ES #F Supply on low volume holiday session The daily chart of the S&P 500 mini futures contract above shows our proprietary SUPPLY and DEMAND Dashboard and BXB (Bar by Bar) Signals using data from the NYSE.
Strong Supply was evident in Fridays shortened holiday session on low volume. The ES lost 19.50-points. Last month’s low at 2603 should be tested and maybe taken out. As stated in previous assessments our down side targets / support were identified at 2657.00 (already taken out), 2625.00, 2567.00, 2542.50 and 2475.00. The ES is still looking weak on the comparative strength analysis chart and the 2603.00 to 2595.00 area should offer resistance in the near term, if enough demand emerge at these levels. A rebound Monday is also possible as the ES came within 1-point of the 2625.00 target on Friday and is near the “Fear” (oversold) level, which can offer support. This is a decision point which must be watched carefully. In our view only a close above 2762.50 accompanied by strong demand, will threaten the near term down trend. If a strong “Bear market rally” occurs, it should find resistance at 2748.75. The above levels are our major decision points identified and it is possible that some of these levels can come into play in the near term. Careful assessment of Supply and Demand at or near these levels should give a possible roadmap in conjunction with other factors and signals, to make more informed trading decisions. Daily Signals November the 23rd: S & D Dashboard Algorithm turned Bearish, and Daily Signals are mixed % > VWAP improved on Friday Caution: A rally is possible Monday, but without strong demand it will not last. If the 2625.00 level holds a pullback to the upside should materialise.
Link to Facebook Group where these assessments are also posted regularly. Click here for example of reversal trade taken in Feeder Cattle that can be found on this page. METALS MOVING IN UNISON FOR A MASSIVE PRICE ADVANCE: PART II As we continue to explore our custom research into the metals markets and our presumption that the metals markets are poised for a massive price rally over the next few months/years, we pick up this second part of our multi-part article illustrating our research work and conclusions. If you missed the first part of this article, please take a minute to review it by before continuing further (Link to Part I). Click on this link or chart above to read more.... Source: RISK DISCLOSURE: The information delivered here is for educational purposes only and is not intended to be a recommendation to purchase or sell any of the stocks, futures or other securities referenced. All references are for illustrative purposes only and are not considered endorsed or recommended for purchase or sale by MC Trading. Trading Forex, Stocks and Options, Futures and any Commodity, Crypto or ETF contains substantial risk and is not for every investor. An investor could potentially lose all or more than the initial investment. Risk capital is money that can be lost without jeopardizing ones financial security or life style. Only risk capital should be used for trading and only those with sufficient risk capital should consider trading. Past performance is not necessarily indicative of future results and no representation is being made that any account will or is likely to achieve profits or losses similar to those shown. MCTrading has taken reasonable measures to ensure the accuracy of the information contained herein and on this website, however MCTrading does not guarantee its accuracy and is not liable for any loss or damage which may result directly or indirectly from such content or from an inability to access such information or any delay in or failure of the transmission or receipt of any instruction or notification in connection therewith. |


