|
JOIN OUR MAILING LIST |
|
Assessments / Blog 2019-02-26 ES #F Weakening Demand
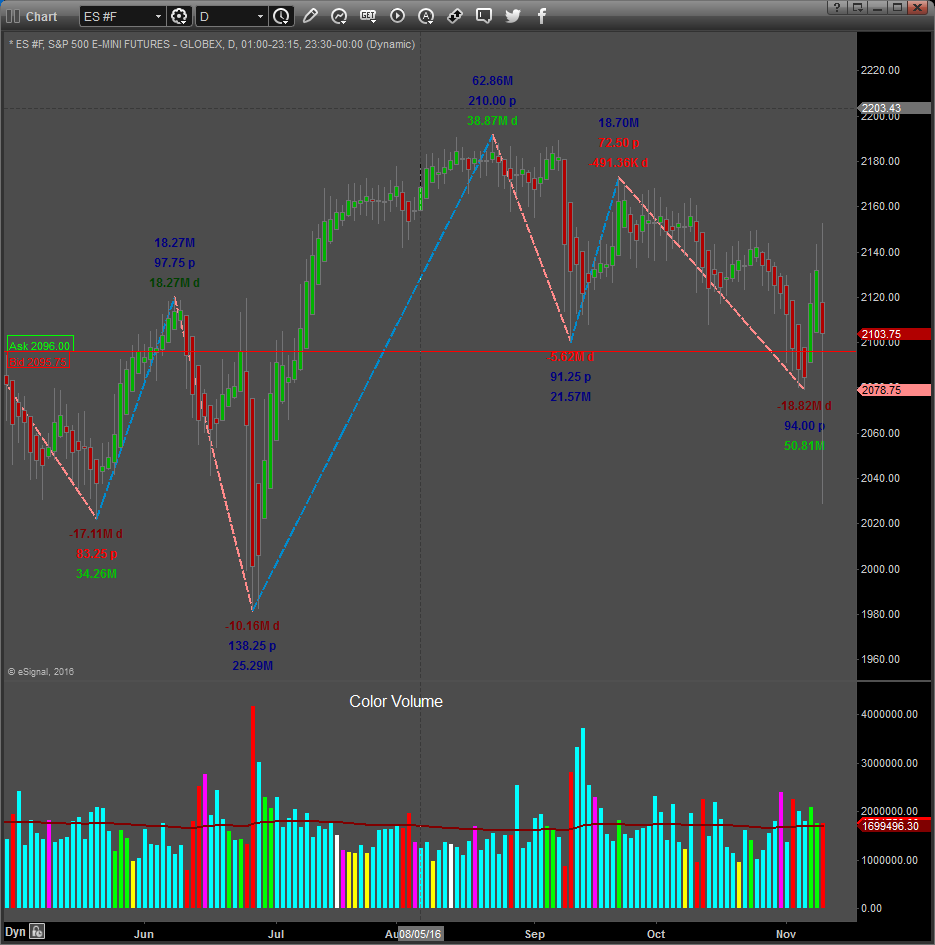
The daily chart of the S&P 500 mini futures contract above shows our proprietary SUPPLY and DEMAND Dashboard and BXB (Bar by Bar) Signals using data from the NYSE. The Vertical acceleration zone where prices started an acceleration to the down side on December the 4ih 2018, has been “taken out”. Price reached the important 2814.00 level (the last major swing high). Demand weakened Yesterday and Delta volume was negative for the Day (more selling than buying calculated on a 1-minute basis). Selling pressure is developing and we have the daily down bar of the 21st in the back ground that closed near the low, engulfing the previous 3 bars (Outside bar) and closed lower than the previous 4 bars. Yesterday was also a key reversal bar (closing on the lows). All this increases the possibility for a pullback to the down side in the near term. Resistance in the 2696.75 to 2677.75 area can be expected if the market trades downwards. Any bar close above the last major swing high at 2814.00, will increase the possibility of another new all-time high. End of the day Signals February the 25th: S & D Dashboard Algorithm is Bullish, but Demand is weakening. Average volatility is nearing Bear territory Daily Signals turned Bearish These readings are an independent assessment of the one and only measureable fundamental market mover: SUPPLY and DEMAND. It does not matter if price is influenced by a geopolitical event, seasonality, fundamental economic data releases or sentiment driven news, etc. It all reflects in Supply and Demand, the “footprints” of the “Big Boys” or “Smart Money”. Caution: Volatility picked up Yesterday and can accelerate. TRADERS MUST STAY OPTIMISTIC PART 5 – THE ENDThis, the final segment of our multi-part research post regarding the potential future market direction as well as to identify if there is any real concern for traders regarding a “total market collapse” as some Doomsayers are predicting should help you understand what our researchers believe is the most likely outcome. In the previous segments of this research post, we’ve covered everything from the globalization of markets and economies to key elements of core pricing levels and valuation levels of economies, equities markets and more. The data is out there if you know where to find it and how to read it. All one has to do is step back from the shorter term charts and see the bigger picture for a bit. As promised, we’re going highlight some very informative future market predictions using our proprietary Adaptive Dynamic Learning (ADL) predictive price modeling tool. This modeling tool has been able to call the past 20+ months of market activity very accurately and help to guide us in understanding what is really taking place in the US stock market – read more about it here. Click on this link to read more.... MOMENTUM STOCK TRADING STRATEGY FOR OPTIONABLE STOCKS It been a great couple weeks for members of our newsletter as we start to provide more of our As technical traders, we specialize in trading price action and momentum. Take a look at our most recent closed trades. GET CHRIS’ ETF AND STOCK PICKS TODAY – SUBSCRIBE HERE
|


