|
JOIN OUR MAILING LIST |
|
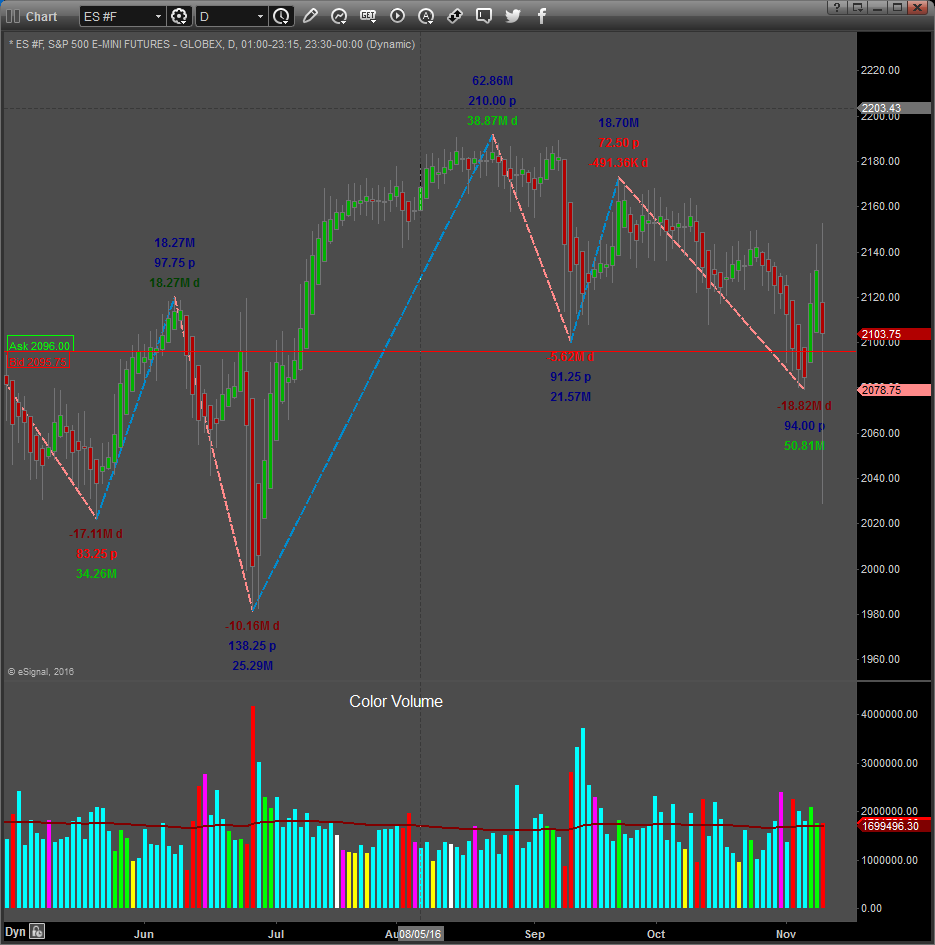
Assessments / Blog 2018-11-02 ES #F Demand with climax low in Volatility The daily chart of the S&P 500 mini futures contract above shows our proprietary SUPPLY and DEMAND Dashboard and BXB (Bar by Bar) Signals using data from the NYSE. Price advanced for the past few days as expected. The ES closed higher by 23.00-points Yesterday with Supply / Demand Volatility the lowest since October the 16th (the day before the recent 2nd leg sell-off began). Demand came in stronger than the day before, but price did not move as much as the day before Yesterday which is an anomaly. Although Buying pressure is on the increase, the result is less than what would be expected for the Buying efforts? The market does not appear so strong as it should have been with the strong Demand and Volatility data readings, and a downward movement today or Monday is a possibility. Resistance to the upside is at 2756.00 and this level could be tested before a pullback to the downside occurs. Daily Signals November the 1st: S & D Dashboard Algorithm and Daily Signals are all Bullish Volatility decreased to 47% and reached a very low level, making a bearish reversal a possibility Caution: The Supply and Demand Sentiment Tool is nearly at the Greed level. Volatility reached a climatic low and may reverse to the Bearish side. Wild price swings are still a possibility.
Link to Facebook Group where these assessments are also posted regularly. Click here for example of reversal trade taken in Feeder Cattle that can be found on this page. GOLD, US DOLLAR, CANADIAN DOLLAR, MARKETS IN 2019 Click on this link to listen to the podcast!
GOLD SETS UP FOR A NOVEMBER 2018 RALLY TO NEAR $1300 Yesterday’s upside price move in gold, already up over $18 (+1.5%), sets up a real potential for a move to near $1300 before the end of November. We have been advising our followers that a strong potential for an upside move in the precious metals markets was likely and that a potential move to above $1300 was in the works prior to the end of 2018. Global economic concerns and the fact that global central banks are accumulating physical gold are putting pricing pressures on Gold and many of the other precious metals. This is a sleeper trade in many ways, the US equity markets and the US Dollar are much stronger than many expected. A true capital shift is taking place throughout the globe at the moment and many foreign nations and central banks are hedging risk by accumulating physical gold. When the price of Gold does really start to move higher, it could be an explosive move to the upside – just like what happened back in 2005~2008 and 2009~2012. Click on this link or chart above to read more.... Source: |


