|
JOIN OUR MAILING LIST |
|
Assessments / Blog 2019-01-08 ES #F Demand and mixed signals
The ES rallied for another session and gained 19.25-points Yesterday. The Supply/Demand algorithm is still Bullish, but the daily signals is pointing downwards and Average Volatility reached a climax. This normally result in a pullback or reversal to the down side within a day or two. The Comparative strength tool is also approaching the “blue line”, and can lead to weakness, when crossing the line downwards. Resistance to the upside is identified at 2568.00, 2583.00, 2603.00, 2625.00 and 2676.00. We expect the market to go sideways or make a pullback Today. Should the market trade downwards, our support zones are at 2529.00, 2487.50, 2456.00 and 2431.00. An unfilled gap exists to the downside in the 2456.00 area? End of the day Signals January the 7th: S & D Dashboard Algorithm Bullish, but the Daily Signals turned Bearish Average Supply / Demand Volatility reached a climax These readings are an independent assessment of the one and only measureable fundamental market mover: SUPPLY and DEMAND. It does not matter if price is influenced by a geopolitical event, seasonality, fundamental economic data releases or sentiment driven news, etc. It all reflects in Supply and Demand, the “footprints” of the “Big Boys” or “Smart Money”. Caution: Comparative strength is weakening, keep an eye on Volatility. If Volatility increases, a move down is a possibility.
Link to Facebook Group where these assessments are also posted regularly. Click here for example of reversal trade taken in Feeder Cattle that can be found on this page.
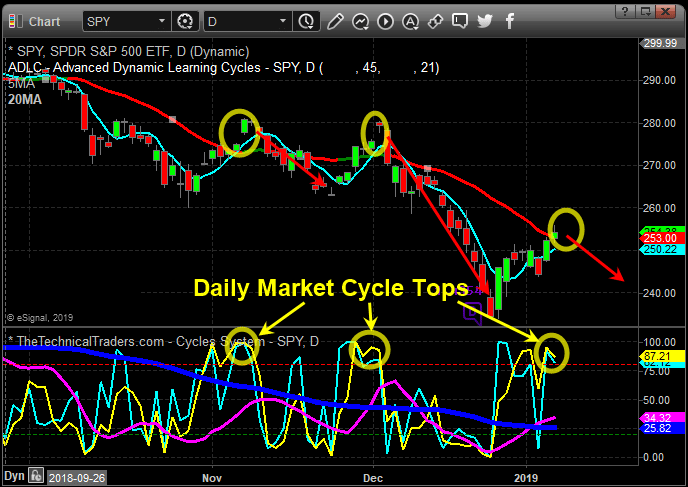
HOW TO SPOT A TRADABLE MARKET TOP?
If you are a long-term investor, swing trader, or day trader, then you could find one or all of the charts below interesting. What I am going to briefly cover and show you could make you think twice about how you are investing and trading your money. I will be the first to admit you should not, and cannot, always pick market tops or bottoms, but there are certain times when it’s worth betting on one. Below I have shared three charts, each with a different time frame using daily, 30 minutes, and a 10-minute chart. Each chart also has a different technical analysis technique and strategy applied. Each shorter time frame chart as we work down the page zooms in closer to more imminent price action that should take place over the next few days. Click on chart or this link to read more.... SPIKES!
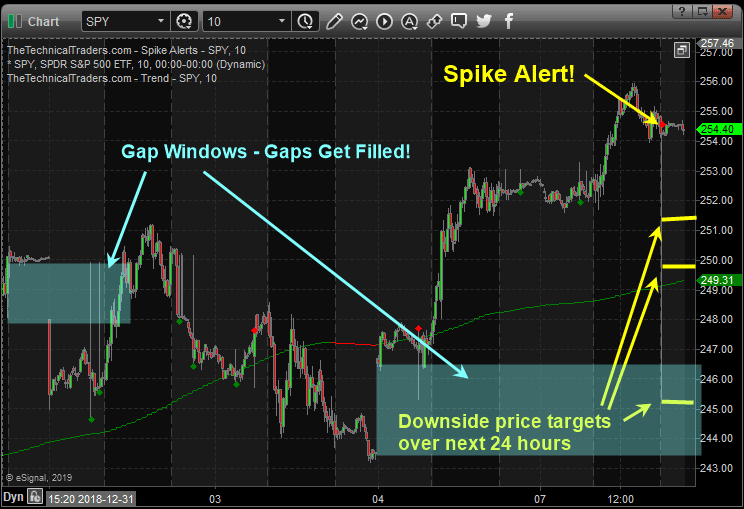
So far in 2019 we have had six price spikes five winners, one loser which is an 83% win rate thus far. Today’s spike is abnormally large not sure what that means regarding this one being a success but it is another spike signal, and the odds favor a move down once you see the other analysis supporting this setup. Watch the video on how we trade price spikes: https://www.youtube.com/watch?v=jq-SrF-B8MU
RISK DISCLOSURE: The information delivered here is for educational purposes only and is not intended to be a recommendation to purchase or sell any of the stocks, futures or other securities referenced. All references are for illustrative purposes only and are not considered endorsed or recommended for purchase or sale by MC Trading. Trading Forex, Stocks and Options, Futures and any Commodity, Crypto or ETF contains substantial risk and is not for every investor. An investor could potentially lose all or more than the initial investment. Risk capital is money that can be lost without jeopardizing ones financial security or life style. Only risk capital should be used for trading and only those with sufficient risk capital should consider trading. Past performance is not necessarily indicative of future results and no representation is being made that any account will or is likely to achieve profits or losses similar to those shown. MCTrading has taken reasonable measures to ensure the accuracy of the information contained herein and on this website, however MCTrading does not guarantee its accuracy and is not liable for any loss or damage which may result directly or indirectly from such content or from an inability to access such information or any delay in or failure of the transmission or receipt of any instruction or notification in connection therewith. |