|
JOIN OUR MAILING LIST |
|
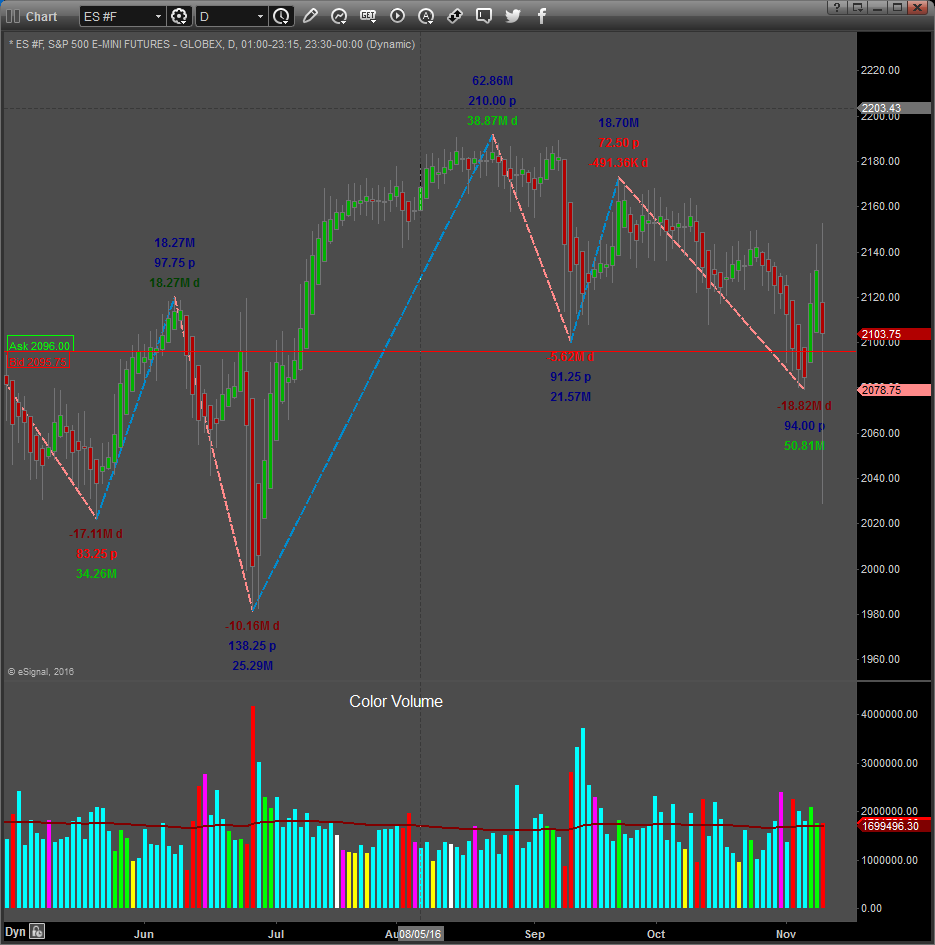
Assessments / Blog 2018-05-16 ES #F Pullback The daily chart above shows our SUPPLY and DEMAND Dashboard and BXB (Bar by Bar) Signals. Readings are based on Supply and Demand and Volume internal data of the total market. It is updated in real time during the regular trading session of the NY Stock exchange and does NOT take into account any price indicators or mathematical formulas using price. We do however show the cumulative price change for the trading session and in some instances assess price movement’s relationship to Supply and Demand. It is therefore fair to say that the readings and signals are independent from other popular price indicators and others shown on the chart. The readings are an independent assessment of the one and only measureable fundamental market mover: SUPPLY and DEMAND. It does not matter if price is influenced by a geopolitical event, seasonality, fundamental economic data releases or sentiment driven news, etc. It all reflects in Supply and Demand, the “footprints” of the “Big Boys” or “Smart Money”. In our last assessment we warned about a possible pullback. Yesterday the market responded with a 22.00-point decline. The Supply/Demand Sentiment tool broke through the zero level with Supply dominating the whole regular trading session. We can see that Demand reached a peak on 4 May 2018 and slowly subsided since then, showing a Divergence until it broke through the zero level (Supply starting to dominate). It is difficult to say where the pullback will end before the bullish path continue again. The 2700.50, 2692.00 and 2682.25 levels should be watched for a possible bounce from here to the upside. Daily Signals May the 15th Dashboard: The Supply and Demand Reading (1st row) was -2.8 Yesterday which indicates Supply had the upper hand. Supply and Demand Direction (3nd row) was to the downside (maroon down triangle), indicating downwards direction, with No substantial strength. Average Supply and Demand Volatility (4th row) is now above 100% and is bearish. The change in average Volatility from the previous day was negative 37 (bearish) as shown on the right of Sup/Dem Dashboard. BXB Signals: We have no signal on the signals board (1st row). Daily Volatility direction (2nd row) was Down (maroon down triangle). The change in daily Volatility from the previous day was negative 60 (bearish) shown on the right of BXB Dashboard. The NY Stock market traded Higher for the day (blue up triangle in 3rd row). 54% of stocks (4th row) traded above there VWAP (Volume Weighted Average Price) compared to the previous day’s 39%, a positive sign for the markets. In short Supply overcame Demand which resulted in a 22.00-point down move Yesterday. The Divergence showed on the Supply/Demand Sentiment tool played out when Supply overcame demand. We expect the down move to end at 2700.50 or 2692.00 or 2682.25, before the market bounce and continue the upward path again. Caution: We expect the bounce to be sudden and ferocious, typically like the V-shaped bottom formations we saw so often the last 2 years, so be careful. Resistance to the up side is at 2718.50 and 2744. A break above this levels can test the 2807.25 level. Intraday We took two opportunities during the trading session Yesterday on the 26-minute chart below: Strategy is simple, enter when 2 Dashboards align and exit when two opposite triangles on BXB Dashboard appears. Entries and exits are shown with arrows on the chart. The last sub window on the chart shows the Greed / Fear sentiment measurements of Supply and Demand Sentiment tool. Similar to an Oversold / Overbought situation (but without using price related formulas). Notice how Supply stepped in at the beginning of the session, then subsided a bit, but was dominant through the session. RISK DISCLOSURE: The information delivered here is for educational purposes only and is not intended to be a recommendation to purchase or sell any of the stocks, futures or other securities referenced. All references are for illustrative purposes only and are not considered endorsed or recommended for purchase or sale by MC Trading. Trading Forex, Stocks and Options, Futures and any Cryptocurrency, Commodity or ETF contains substantial risk and is not for every investor. An investor could potentially lose all or more than the initial investment. Risk capital is money that can be lost without jeopardizing ones financial security or life style. Only risk capital should be used for trading and only those with sufficient risk capital should consider trading. Past performance is not necessarily indicative of future results and no representation is being made that any account will or is likely to achieve profits or losses similar to those shown. MCTrading has taken reasonable measures to ensure the accuracy of the information contained herein and on this website, however MCTrading does not guarantee its accuracy and is not liable for any loss or damage which may result directly or indirectly from such content or from an inability to access such information or any delay in or failure of the transmission or receipt of any instruction or notification in connection therewith. |


