|
JOIN OUR MAILING LIST |
|
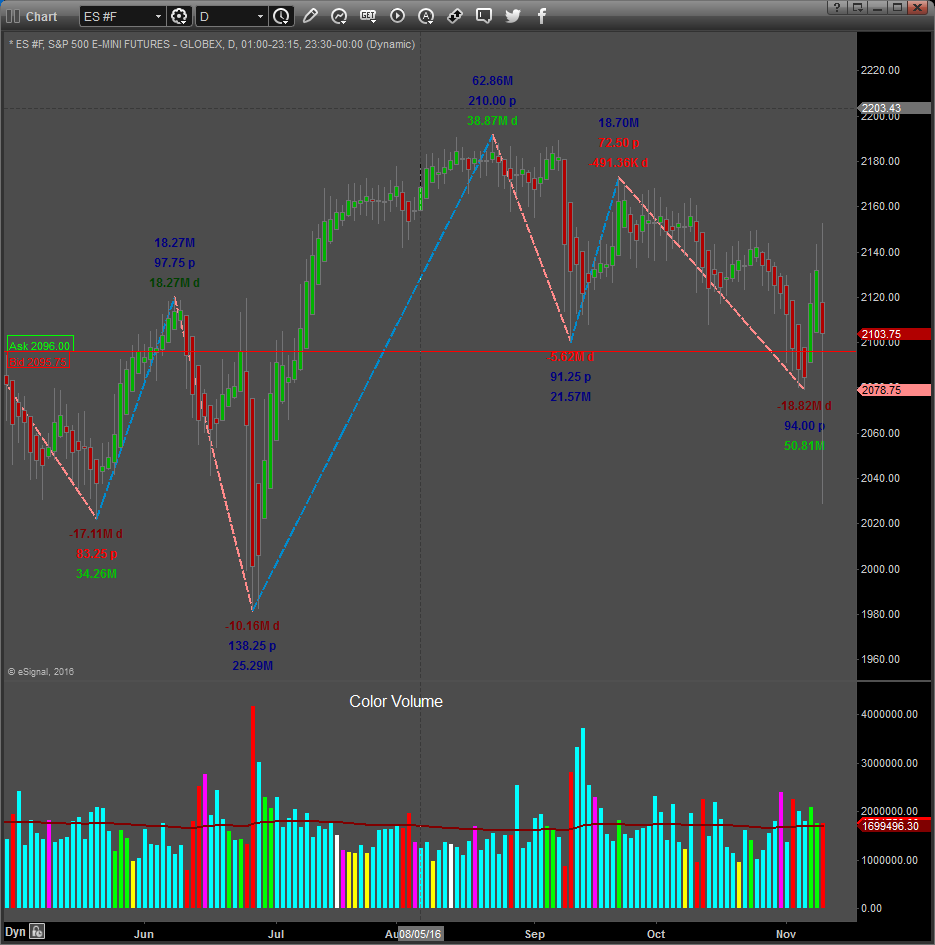
Assessments / Blog 2019-03-12 ES #F Demand with strong up move Demand dominated for the duration of the trading session Yesterday, with the ES closing higher by 38.75-points (the highest point gain since January the 30th). This strong up move was not expected after the poor economic data releases on Friday. Buying pressure is developing, and Comparative strength increased. A close above the last swing high at 2819.75 will turn the immediate trend to Bullish. The Supply and Demand Sentiment is in the “Greed” territory (Overbought) and the Percentage of stocks above their Volume Weighted Average Price closed at 70%, the highest level since January the 17th. Please note: The data on the chart for the ES continuous contract is for the June 2019 contract. The March contract expire on the 15th. End of the day Signals March the 11th: S & D Dashboard Algorithm turned Bullish Daily Signals pointing to the upside These readings are an independent assessment of the one and only measureable fundamental market mover: SUPPLY and DEMAND. It does not matter if price is influenced by a geopolitical event, seasonality, fundamental economic data releases or sentiment driven news, etc. It all reflects in Supply and Demand, the “footprints” of the “Big Boys” or “Smart Money”. Caution: The market may be over stretched, but we have to wait and see where price moves today. Link to Facebook Group where these assessments are also posted regularly.
THIS STOCK MARKET POP COULD FIZZLE FAST
The US stock market opened today with mixed opening prices. The crash of the Ethiopian Boeing passenger jet prompted selling in the Blue Chips, particularly in Boeing (BA). As of right now, the US stock markets have recovered quite well and have pushed higher. We believe this upward rotation may be short-lived and want to highlight the two Engulfing Bearish candlestick patterns that have formed recently. The first, near the October 2018 highs, prompted a very deep price correction that ended on December 24, 2018. The more recent, completed just on March 8, 2019, is setting up resistance just above recent highs ($175.95) and is still a very valid sell signal for the QQQ. Unless the price is able to breach the $175.95 level over the next few weeks, this Engulfing Bearish candlestick pattern is technically the key pattern driving future expectations for the price. Click on this link to read more.... RISK DISCLOSURE: The information delivered here is for educational purposes only and is not intended to be a recommendation to purchase or sell any of the stocks, futures or other securities referenced. All references are for illustrative purposes only and are not considered endorsed or recommended for purchase or sale by MC Trading. Trading Forex, Stocks and Options, Futures and any Cryptocurrency, Commodity or ETF contains substantial risk and is not for every investor. An investor could potentially lose all or more than the initial investment. Risk capital is money that can be lost without jeopardizing ones financial security or life style. Only risk capital should be used for trading and only those with sufficient risk capital should consider trading. Past performance is not necessarily indicative of future results and no representation is being made that any account will or is likely to achieve profits or losses similar to those shown. MCTrading has taken reasonable measures to ensure the accuracy of the information contained herein and on this website, however MCTrading does not guarantee its accuracy and is not liable for any loss or damage which may result directly or indirectly from such content or from an inability to access such information or any delay in or failure of the transmission or receipt of any instruction or notification in connection therewith.
|


