|
JOIN OUR MAILING LIST |
|
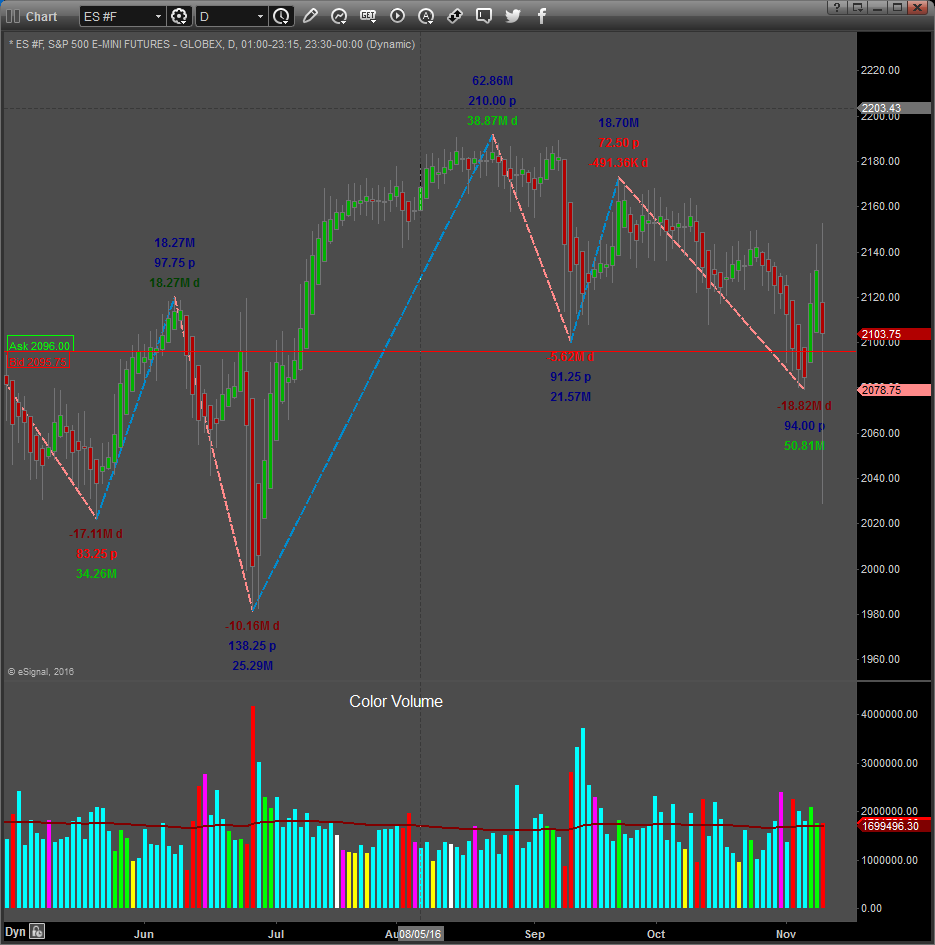
Assessments / Blog 2018-10-11 ES #F Supply galore and Sell-off led by $TRANS The daily chart of the Transportation Index above (Left). Yesterdays breakdown below 10925.00 led the deeper sell-off in the markets. Click link for previous commentary. The daily chart of the S&P 500 mini futures contract above (Right), shows our proprietary SUPPLY and DEMAND Dashboard and BXB (Bar by Bar) Signals using data from the NYSE. The expected rally attempt to the 2914.50 area did not happen Yesterday, but the 2865.00 level (warned about in previous assessments) was taken out and the market crashed down. We also warned about the Transportation index reaching a critical level Yesterday and this level was taken out. Selling pressure and Volatility was sustained and the market sold off. More weakness is a possibility, but it is unlikely that it will reach the magnitude of Yesterday’s sell-off. A rebound can be expected in the near term and the 2771.50 to 2803.00 level may offer resistance. In our assessment on September the 8th we mentioned: “Our longer term outlook remains Bullish, however our proprietary target projection system shows that, if the longer term uptrend is broken a sell-off to the 2772.50 level is a possibility before the end of the year.” This level was reached sooner than expected Yesterday. The failure of the market to make a new high after September the 21st strengthened the probability of this pattern to play out. Daily Signals October the 10th: S & D Dashboard Algorithm and Daily Signals all remain Bearish Caution: The market is highly Volatile at the moment and rebounds with more weakness is a possibility. Be warned that historically, October is the most Volatile month of the year!
Link to Facebook Group where these assessments are also posted regularly. Click here for example of reversal trade taken in Feeder Cattle that can be found on this page. CLICK ON THIS LINK OR CHART ABOVE TO LEAR MORE…… Source:
RISK DISCLOSURE: The information delivered here is for educational purposes only and is not intended to be a recommendation to purchase or sell any of the stocks, futures or other securities referenced. All references are for illustrative purposes only and are not considered endorsed or recommended for purchase or sale by MC Trading. Trading Forex, Stocks and Options, Futures and any Commodity or ETF contains substantial risk and is not for every investor. An investor could potentially lose all or more than the initial investment. Risk capital is money that can be lost without jeopardizing ones financial security or life style. Only risk capital should be used for trading and only those with sufficient risk capital should consider trading. Past performance is not necessarily indicative of future results and no representation is being made that any account will or is likely to achieve profits or losses similar to those shown. MCTrading has taken reasonable measures to ensure the accuracy of the information contained herein and on this website, however MCTrading does not guarantee its accuracy and is not liable for any loss or damage which may result directly or indirectly from such content or from an inability to access such information or any delay in or failure of the transmission or receipt of any instruction or notification in connection therewith. |


